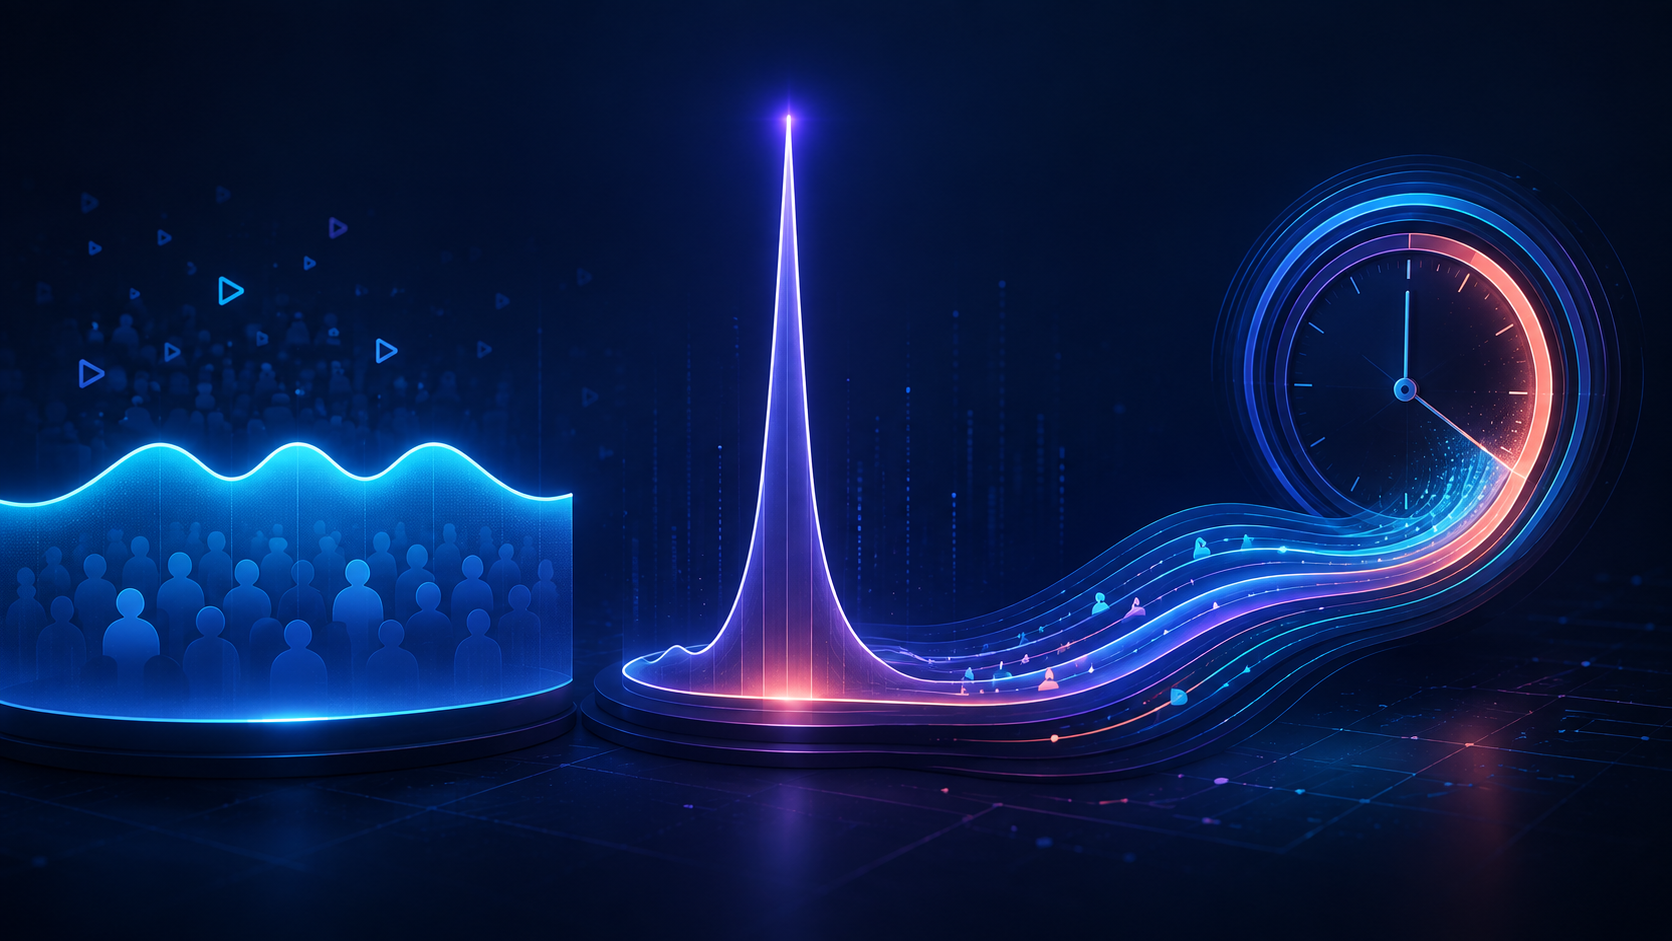
Average Viewers, Peak Viewers, and Hours Watched are three of the most frequently used metrics in livestreaming analytics. They often appear beside one another on channel pages and performance reports, but they do not measure the same thing.
Peak Viewers captures the largest audience reached at one moment. Average Viewers shows the typical concurrent audience maintained across a broadcast or reporting period. Hours Watched measures the total amount of time the audience spent watching.
So which streaming metric matters most? Average Viewers is generally the most useful single indicator of a channel's stable live audience. Peak Viewers is better for measuring the maximum impact of a specific moment or event, while Hours Watched is better for measuring total audience consumption. None of them provides a complete performance assessment without stream duration, content format, and audience context.
This guide explains the differences between the three metrics, their strengths and limitations, and how creators, brands, and analysts should use them in 2026.
Average Viewers vs Peak Viewers vs Hours Watched: Quick Comparison
| Metric | What it measures | Best used for | Main limitation |
|---|---|---|---|
| Average Viewers | Typical concurrent audience | Channel stability, recurring performance, sponsorship baselines | Can hide individual peaks, declines, and category differences |
| Peak Viewers | Highest concurrent audience at one moment | Event impact, records, major segments, collaborations | One brief spike may not represent the full stream |
| Hours Watched | Total viewing time accumulated by the audience | Overall consumption, market share, campaign scale | Strongly influenced by Hours Streamed |
The best metric depends on the question:
-
How many people normally watch this creator? Use Average Viewers.
-
What was the largest audience reached? Use Peak Viewers.
-
How much total attention did the channel generate? Use Hours Watched.
For a full channel assessment, use all three and add Hours Streamed, follower growth, category performance, and native engagement data.
What Does Average Viewers Mean?
Average Viewers, sometimes described as Average Concurrent Viewers or Average CCV, represents the typical number of people watching simultaneously during a stream or selected reporting period.
Platforms and analytics services calculate it by sampling or aggregating concurrent viewership across time. The exact technical method and processing interval can vary, but the purpose remains the same: to describe the audience maintained rather than the largest moment reached.
Why Average Viewers Is Often the Best Baseline Metric
Average Viewers is useful because it reduces the influence of one temporary spike. If a creator reaches 50,000 viewers for several minutes but spends most of the stream near 10,000, the average audience will remain much closer to the normal viewing level.
This makes the metric valuable for:
| Use case | Why Average Viewers helps |
| Comparing recurring streams | Shows whether the typical audience is growing or declining |
| Evaluating sponsorships | Provides a baseline for expected concurrent exposure |
| Comparing categories | Reveals which game or format maintains the strongest audience |
| Tracking channel health | Shows whether improvements continue beyond one viral event |
| Building peer benchmarks | Supports comparisons among creators with similar formats and schedules |
Average Viewers is also harder to inflate through a single successful moment than Peak Viewers. For creators who stream regularly, it usually provides the clearest starting point for evaluating current audience strength.
The Limitations of Average Viewers
An average compresses the entire audience curve into one number. Two streams can produce the same Average Viewers while behaving very differently.
One stream might maintain a stable audience from beginning to end. Another might start with a large crowd and lose viewers continuously. The resulting averages could be similar even though the audience experience and future potential were not.
Long introductions, breaks, technical delays, or low-interest closing segments can also reduce the average. Conversely, a short broadcast concentrated around one important event may produce a high Average Viewers figure because it ends before audience interest declines.
Average Viewers should therefore be read with Peak Viewers, stream duration, and the audience timeline.
What Does Peak Viewers Mean?
Peak Viewers is the highest number of concurrent viewers recorded during a livestream. It represents one moment, not the cumulative number of people who watched and not necessarily the audience maintained for the entire broadcast.
Peaks can be caused by:
-
a major announcement or reveal;
-
a tournament final or decisive game;
-
a celebrity or creator collaboration;
-
a raid, host, or recommendation boost;
-
a product launch or giveaway result;
-
a viral IRL moment;
-
breaking news or an unexpected event.
When Peak Viewers Matters Most
Peak Viewers is particularly valuable when the stream itself is built around one central moment. Event producers, game publishers, sponsors, and media outlets often want to know the maximum simultaneous audience reached during a final, keynote, product reveal, or major collaboration.
IShowSpeed is a useful example of an event-driven creator. His travel broadcasts, football-related appearances, challenges, and collaborations can produce moments that attract viewers far beyond the ordinary baseline. Peak Viewers helps quantify the largest point of attention, but the stream's Average Viewers and Hours Watched are needed to determine whether that attention lasted.
Esports co-streaming creates similar patterns. The performance of Caedrel can be influenced by tournament stage, participating teams, match importance, and broadcast schedule. A peak reached during a League of Legends final should not become the default expectation for every stream on the channel.
Why Peak Viewers Can Be Misleading
Peak Viewers is visually impressive and easy to use in headlines, but it can exaggerate the typical scale of a channel.
Imagine two hypothetical streams:
| Metric | Stream A | Stream B |
| Peak Viewers | 50,000 | 34,000 |
| Average Viewers | 14,000 | 28,000 |
| Hours Streamed | 4 hours | 4 hours |
| Hours Watched | 56,000 | 112,000 |
Stream A achieved the larger peak, but Stream B maintained twice the average audience and generated twice the watch time. If the goal was a record-setting moment, Stream A performed better. If the goal was sustained exposure or sponsorship value across four hours, Stream B was stronger.
This is why Peak Viewers should never be described as total reach. A stream can have 50,000 Peak Viewers while attracting far more unique viewers across its full duration, because people enter and leave at different times.
What Does Hours Watched Mean?
Hours Watched represents the total amount of viewing time generated by the audience. One viewer watching for one hour contributes one Hour Watched. Ten viewers watching for one hour contribute ten Hours Watched.
In simplified form:
Hours Watched ≈ Average Viewers × Hours Streamed
A channel averaging 10,000 viewers for five hours would generate approximately 50,000 Hours Watched. Minor differences may appear because platforms and analytics providers use their own measurement intervals and processing methods.
When Hours Watched Is the Most Useful Metric
Hours Watched is valuable for measuring the overall scale of audience consumption. It is widely used to evaluate monthly channel performance, streaming categories, games, languages, platforms, and long-term campaigns.
The metric answers questions such as:
-
Which creator generated the most total viewing time this month?
-
Which game captured the largest share of livestream consumption?
-
How much audience attention did a campaign receive across several broadcasts?
-
Did a channel's total market presence increase during the reporting period?
For creators with marathon or high-volume schedules, Hours Watched can reveal an important part of their impact. Kai Cenat, for example, is closely associated with long entertainment broadcasts, subathons, and large collaborative formats. The total consumption generated during these projects cannot be represented by Peak Viewers alone.
xQc is another useful example. High-volume variety streaming can accumulate substantial Hours Watched through a combination of audience size and long airtime. That total reflects real audience consumption, but it should not be compared with a creator who was live for only a few hours without adjusting for the schedule.
Why Hours Watched Must Be Read With Airtime
Hours Watched can grow for two basic reasons:
-
More people watched on average.
-
The creator streamed for more hours.
These two forms of growth have different strategic meanings.
| Performance change | Average Viewers | Hours Streamed | Hours Watched | Interpretation |
| Audience-driven growth | +25% | No change | Approximately +25% | Stronger demand at the same content volume |
| Airtime-driven growth | No change | +25% | Approximately +25% | More total consumption because the creator streamed longer |
| Combined growth | +20% | +20% | Approximately +44% | Larger audience and additional airtime reinforce each other |
| Efficiency decline | −15% | +30% | May still increase | More hours compensate for a weaker average audience |
The combined-growth example is multiplicative: 1.20 × 1.20 = 1.44. This is why Hours Watched can increase faster than either Average Viewers or airtime individually.
High Hours Watched is not automatically evidence of strong retention, profitable monetization, or sustainable production. It measures consumption, not the business outcome produced by that consumption.
Which Streaming Metric Matters Most for Creators?
For most creators, Average Viewers is the most practical top-level metric because it reflects the audience they can usually expect while live. It can help evaluate scheduling, category choices, format changes, and progress toward platform milestones.
However, it should not become the only objective.
| Creator goal | Most useful primary metric | Metrics to add |
| Build a stable community | Average Viewers | Returning viewers, chatters, retention |
| Increase discovery | Peak Viewers or unique viewers | Traffic sources, follower growth |
| Maximize total channel presence | Hours Watched | Average Viewers and airtime |
| Test a new game | Average Viewers by category | Followers Gain and Hours Streamed |
| Produce a special event | Peak Viewers | Average Viewers, unique viewers, Hours Watched |
| Grow followers | Followers Gain | Unique viewers and Average Viewers |
A creator who increases Hours Watched only by streaming longer may face fatigue without improving the underlying audience baseline. A creator who chases peaks may produce occasional viral broadcasts without building a repeatable schedule. Average Viewers is often the best anchor, while the other metrics explain scale and exceptional moments.
Which Metric Matters Most for Brands and Sponsors?
Brands often want one number that summarizes a creator's value. None of the three metrics can do that alone.
Average Viewers is usually the best starting point for estimating the typical concurrent audience exposed to a recurring integration. Hours Watched helps measure the total attention generated across a long broadcast or multi-stream campaign. Peak Viewers shows the maximum scale reached during a major branded moment.
The correct choice depends on the activation:
| Sponsorship format | Metric that deserves priority | Why |
| Recurring logo or overlay | Average Viewers and exposure time | The placement remains visible across the broadcast |
| Sponsored tournament final | Peak Viewers and Average Viewers | Both maximum reach and maintained audience matter |
| Long-term creator campaign | Hours Watched and Average Viewers | Measures total scale and baseline stability |
| Product reveal | Peak Viewers during the segment | The campaign centers on one moment |
| Short verbal integration | Viewers during the exact segment | Channel-wide averages may not represent that placement |
Brands should also consider audience geography, language, category relevance, content safety, follower growth, and placement duration. A channel with the highest Hours Watched may not be the best fit if the audience, content, or integration format does not match the campaign.
Which Metric Matters Most for Games and Streaming Platforms?
Hours Watched is usually the most useful top-level metric for measuring the overall popularity of a game, category, language, or platform over a defined period. It combines the attention generated across every participating channel and hour of content.
Peak Viewers remains valuable for identifying record events and the largest simultaneous audience. Average Viewers can show the typical audience across active broadcasts, but aggregated averages must be interpreted carefully when channel counts and airtime change.
For example, a game can increase its Hours Watched because more creators started streaming it, because existing channels broadcast longer, or because viewers became more interested. Analysts should examine active channels, airtime, Average Viewers, and major events before attributing the increase to organic demand.
How the Three Metrics Work Together
The relationship between Average Viewers, Peak Viewers, and Hours Watched is more informative than any single total.
| Metric pattern | Likely performance model |
| High Average Viewers, moderate peak, high Hours Watched | Stable channel with sustained audience consumption |
| Moderate average, very high peak, moderate Hours Watched | Event-driven or viral stream with a short spike |
| Moderate average, moderate peak, very high Hours Watched | High-volume schedule or marathon content |
| High average, high peak, limited Hours Watched | Short but highly concentrated event |
| Falling average, rising Hours Watched | Additional airtime may be compensating for weaker viewership |
| Rising average, stable airtime, rising Hours Watched | Stronger underlying audience demand |
The first question should not be “Which number is largest?” It should be “What combination of audience size and time produced this result?”
Useful Formulas for Streaming Metric Analysis
Average-to-Peak Ratio
Average-to-peak ratio = Average Viewers ÷ Peak Viewers × 100
This ratio can indicate how closely the maintained audience approached the maximum. It is best used for similar streams on the same channel. An event built around one reveal will naturally have a different ratio from a steady gaming broadcast.
Estimated Hours Watched
Estimated Hours Watched = Average Viewers × Hours Streamed
This formula helps explain whether watch-time growth was caused by audience size, airtime, or both.
Follower Growth Efficiency
Follower growth efficiency = Followers Gain ÷ Hours Watched × 1,000
This non-standard internal benchmark shows how many followers were gained per 1,000 Hours Watched. It can support comparisons among similar creators, but it should not be described as a unique-viewer conversion rate.
Airtime Change
Airtime change = (Current Hours Streamed ÷ Previous Hours Streamed − 1) × 100
Compare this percentage with the change in Hours Watched. If both move at approximately the same rate while Average Viewers remains flat, the additional watch time was mostly volume-driven.
How to Compare Streamers Fairly
Comparing creators requires more than placing three totals in a table. Use channels with similar conditions:
-
the same primary platform;
-
similar games or content categories;
-
the same broadcast language;
-
comparable audience regions and time zones;
-
similar Average Viewers ranges;
-
similar streaming frequency and duration;
-
comparable formats and growth stages.
A creator such as Westcol should be evaluated within the Spanish-language and Latin American streaming ecosystem before being compared directly with an English-language Kick channel. Both may be major creators on the same platform, but language, region, schedule, and content format shape their available audiences.
Use a benchmark group of approximately 10–30 comparable channels and focus on the median. One exceptional creator or special event can distort a small-group average.
How to Compare the Same Creator Across Platforms
Cross-platform activity creates another complication. Twitch, YouTube Gaming, and Kick use different discovery systems, audiences, and reporting methods.
TheBurntPeanut's Twitch profile and YouTube Gaming profile can be analyzed separately to see how Average Viewers, Peak Viewers, Hours Watched, airtime, and category performance vary by platform.
Do not automatically add the two Peak Viewers totals. If the streams happened at different times, their peaks describe different events. If they were simultaneous, the audiences may overlap. A combined total should be labeled as gross cross-platform viewership unless individual viewers have been deduplicated.
Common Mistakes When Reading Streaming Metrics
Calling Peak Viewers “Reach”
Peak Viewers measures the highest simultaneous audience. Reach or unique viewers measures how many different people watched across the stream.
Ranking Channels by Hours Watched Without Checking Airtime
A channel streaming 200 hours per month has more opportunities to accumulate watch time than one streaming for 20 hours.
Assuming Average Viewers Measures Loyalty
Average Viewers shows maintained concurrent audience, but returning-viewer and retention data are needed to evaluate loyalty directly.
Comparing a Viral Stream With a Normal Broadcast
Collaborations, game launches, tournament finals, and major announcements create temporary demand. Compare similar formats or separate event performance from the regular baseline.
Comparing Different Reporting Periods
Seven-day, 30-day, and annual totals cannot be placed beside one another without normalization.
Ignoring Categories and Languages
The available audience differs by game, region, language, and time zone. A raw ranking does not explain the competitive environment.
How StreamMetrix Helps Compare Streaming Metrics
StreamMetrix provides channel analytics for Twitch, YouTube Gaming, and Kick. Public profiles include Average Viewers, Peak Viewers, Hours Watched, Hours Streamed, follower growth, rankings, categories, clips, and recent stream history.
These sections make it possible to move from a headline number to a structured analysis:
-
Check Average Viewers to understand the recent baseline.
-
Compare Peak Viewers to identify the largest moments.
-
Read Hours Watched together with Hours Streamed.
-
Open the category breakdown to find the content driving performance.
-
Review recent streams to identify the exact broadcasts behind the totals.
-
Compare 7-day and 30-day periods to separate short-term spikes from a sustained trend.
For a broader analytical framework, connect these metrics with the principles covered in How to Analyze Your Livestream Performance in 2026.
Final Verdict: Which Streaming Metric Matters Most?
Average Viewers matters most when the goal is to understand a channel's typical live audience and compare recurring performance. Peak Viewers matters most for measuring the maximum impact of a special event or moment. Hours Watched matters most for measuring total audience consumption across time.
If only one metric is available for evaluating a regularly active creator, Average Viewers is usually the most informative starting point. If the subject is an event, Peak Viewers may deserve priority. If the analysis covers a month, game, platform, or long campaign, Hours Watched often becomes the main scale metric.
The strongest analysis never stops at one number. Read Average Viewers, Peak Viewers, and Hours Watched together, then add airtime, category, follower growth, platform, language, and stream format. That context determines whether a large result represents a stable audience, a short-lived spike, a high-volume schedule, or genuine channel growth.
